Generating graphs is a learned ability. It takes some time and experimentation, but isn't too tricky once you've done it once or twice. Graphs are created using rrdtool graph. There are tons of options and ways to configure graph output, but we'll just look at the most commonly used ones. Here is an example to go with the temp monitoring stuff we did earlier:
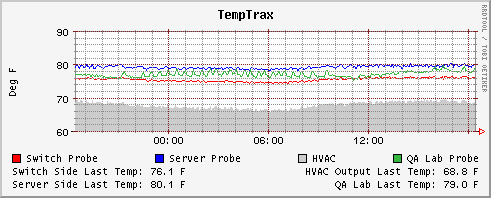
Figure 3. TempTrax Graph Creation Command
rrdtool graph mygraph.png -a PNG --title="TempTrax" \
--vertical-label "Deg F" \
'DEF:probe1=temptrax.rrd:probe1-temp:AVERAGE' \
'DEF:probe2=temptrax.rrd:probe2-temp:AVERAGE' \
'DEF:probe3=temptrax.rrd:probe3-temp:AVERAGE' \
'DEF:probe4=temptrax.rrd:probe4-temp:AVERAGE' \
'LINE1:probe1#ff0000:Switch Probe' \
'LINE1:probe2#0400ff:Server Probe' \
'AREA:probe3#cccccc:HVAC' \
'LINE1:probe4#35b73d:QA Lab Probe' \
'GPRINT:probe1:LAST:Switch Side Last Temp\: %2.1lf F' \
'GPRINT:probe3:LAST:HVAC Output Last Temp\: %2.1lf F\j' \
'GPRINT:probe2:LAST:Server Side Last Temp\: %2.1lf F' \
'GPRINT:probe4:LAST:QA Lab Last Temp\: %2.1lf F\j'
This looks worse than it is. The DEF lines define a Data Source (DS) to use. The LINE and AREA lines define the actual plotting methods. And the GPRINT lines define text that I want rendered onto the graph.
The default image output format is GIF, so using the -a allows you to choose between GIF, PNG and GD formats. --title is the string that is printed onto the top of your graph. --verital-label is an optional string that is printed on the Y axis, typically to denote the metric.
The DEF line DEFines a virtual name (vname) for an RRD Data Source (DS). It might seem odd that you need to define a virtualname, instead of just using the original DS name, but because you define the RRD filename here, you can define multiple DS's from different RRDs, which could be a problem if multiple RRDs have DS's by the same name; this method gets us around that. So the 2nd argument in the DEF line is vname=RRDfilename, followed by the actual original DS name, followed by the Consolidation Function (CF) type specified in your RRA. In this way, we are telling the graphing tool exactly what we want, from what file, from which RRA/view.
The next set of lines are LINE1 and AREA. These are the actual lines on the graph. Lines come in 3 different varieties, LINE1, LINE2, and LINE3. These are actually just Small, Medium, Large. LINE1 draws a 1px line, LINE2 draws a thicker line, and Line3 the thickest, otherwise they all work the same way. AREA is used to define a line that is "filled in". The big green area from 0 to your value in MRTG are AREAs. The form for all these types is the type, followed by the vname and a color specified in hex RGB value. Do note that if you do not specify a color the line won't show up! The final argument is the name of the line itself, this is printed at the bottom of the graph with the color key.
Finally, the GPRINT line allow us to write other stuff on the outputted graph. Generally it's nice to see the current values printed, so we'll draw those on. The first argument obviously is GPRINT, the second is the vname. The third argument is the CF type for data printed, here I'm using LAST because I want the most current value. And the final argument is the line thats actually printed. You will need to escape out colons here if you them so they don't chop off your line. Also, \j can be used to justify a line (push it to the right side of the graph). Inserting numeric values are done like in many programming languages: %1.1lf would give you a single precision floating point number, like 5.2 or 0.6, and %2.4lf would be a number like 23.1412. Whole number can be rounded with %2.0lf.
I used two separate scripts (PERL for the update, and Borne for the graphing) but ultimately it is probably cleaner to combine the two so that you are only running one script from cron.