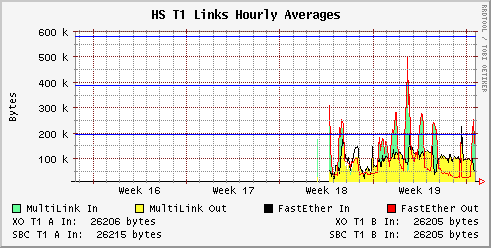
Continuing from our last example, lets create some other graphs for historical purposes. You'll recall that when we created the RRD we specified two different RRA's: LAST (for the most current data) and AVERAGE (for hourly averages). Now that I've got acouple days worth of data in my RRD I want to look at the historical graphs. We'll do this by creating a duplicate graphing script as we did above, but we'll add an extra argument to the rrdtool graph command: --start and optionally --end.
Lets just look at the example. The following graph generation script is exactly the same as the one we created in the last section, but I've added the --start argument and changed the RRA's specified in both the DEFs and GPRINTs from LAST to AVERAGE to ensure we get the right values.
Figure 10. 1 Month Historical Graph Creation Script
#!/bin/bash

rrdtool graph wanoutput-hist.png -a PNG \
--title="HS T1 Links Hourly Averages" --vertical-label "Bytes" \
--height 150 \
--start "-1month" \
'DEF:s00in=wan-thruput.rrd:Serial00_In:AVERAGE' \
'DEF:s01in=wan-thruput.rrd:Serial01_In:AVERAGE' \
'DEF:s10in=wan-thruput.rrd:Serial10_In:AVERAGE' \
'DEF:s11in=wan-thruput.rrd:Serial11_In:AVERAGE' \
'DEF:fe20in=wan-thruput.rrd:FastEth20_In:AVERAGE' \
'DEF:mlin=wan-thruput.rrd:MutliLink_In:AVERAGE' \
'DEF:s00out=wan-thruput.rrd:Serial00_Out:AVERAGE' \
'DEF:s01out=wan-thruput.rrd:Serial01_Out:AVERAGE' \
'DEF:s10out=wan-thruput.rrd:Serial10_Out:AVERAGE' \
'DEF:s11out=wan-thruput.rrd:Serial11_Out:AVERAGE' \
'DEF:fe20out=wan-thruput.rrd:FastEth20_Out:AVERAGE' \
'DEF:mlout=wan-thruput.rrd:MutliLink_Out:AVERAGE' \
'HRULE:193000#0000ff' \
'HRULE:386000#0000ff' \
'HRULE:579000#0000ff' \
'HRULE:772000#0000ff' \
'AREA:mlin#66FF99:MultiLink In' \
'AREA:mlout#FFFF33:MultiLink Out' \
'LINE1:fe20in#000000:FastEther In' \
'LINE1:fe20out#ff0000:FastEther Out' \
'GPRINT:s00in:AVERAGE:XO T1 A In\: %6.0lf bytes ' \
'GPRINT:s01in:AVERAGE:XO T1 B In\: %6.0lf bytes\j' \
'GPRINT:s10in:AVERAGE:SBC T1 A In\: %6.0lf bytes' \
'GPRINT:s11in:AVERAGE:SBC T1 B In\: %6.0lf bytes\j'
Using the graph arguments --start and --end we can specify the window of time the graph displays. By default (no start/end arguments) the graph starts 24hours ago, and ends "now", so that we always see one full day of values. If we want to see a larger period of time we can change the start time to something more useful. Generally you won't need to use the end argument because you want it to end now which is the default, but it works just like the start argument does in case you wanted to, for instance, create a historical graph just for the month of December. Start and End times are specified in forms accepted by the UNIX at command, therefore you can specify absolute seconds since the Epoch or "Jan 10" as a specific date. You can also use more useful relative times such as "yesterday", "-1month" (One Month Ago), "-2weeks", "-1year", etc. Check out the rrdfetch man page for more details. In our graph above, I've decided to give 1 month of historical data. Below is the output.
Using a script like the one above can be easily duplicated or modified in order to show almost any range of statistical data. Depending how many RRAs you created you can get some very granular details.
